
Program "Overview LAB"
Path to the program: Reporting > Sales > Overview LAB
Purpose of the program
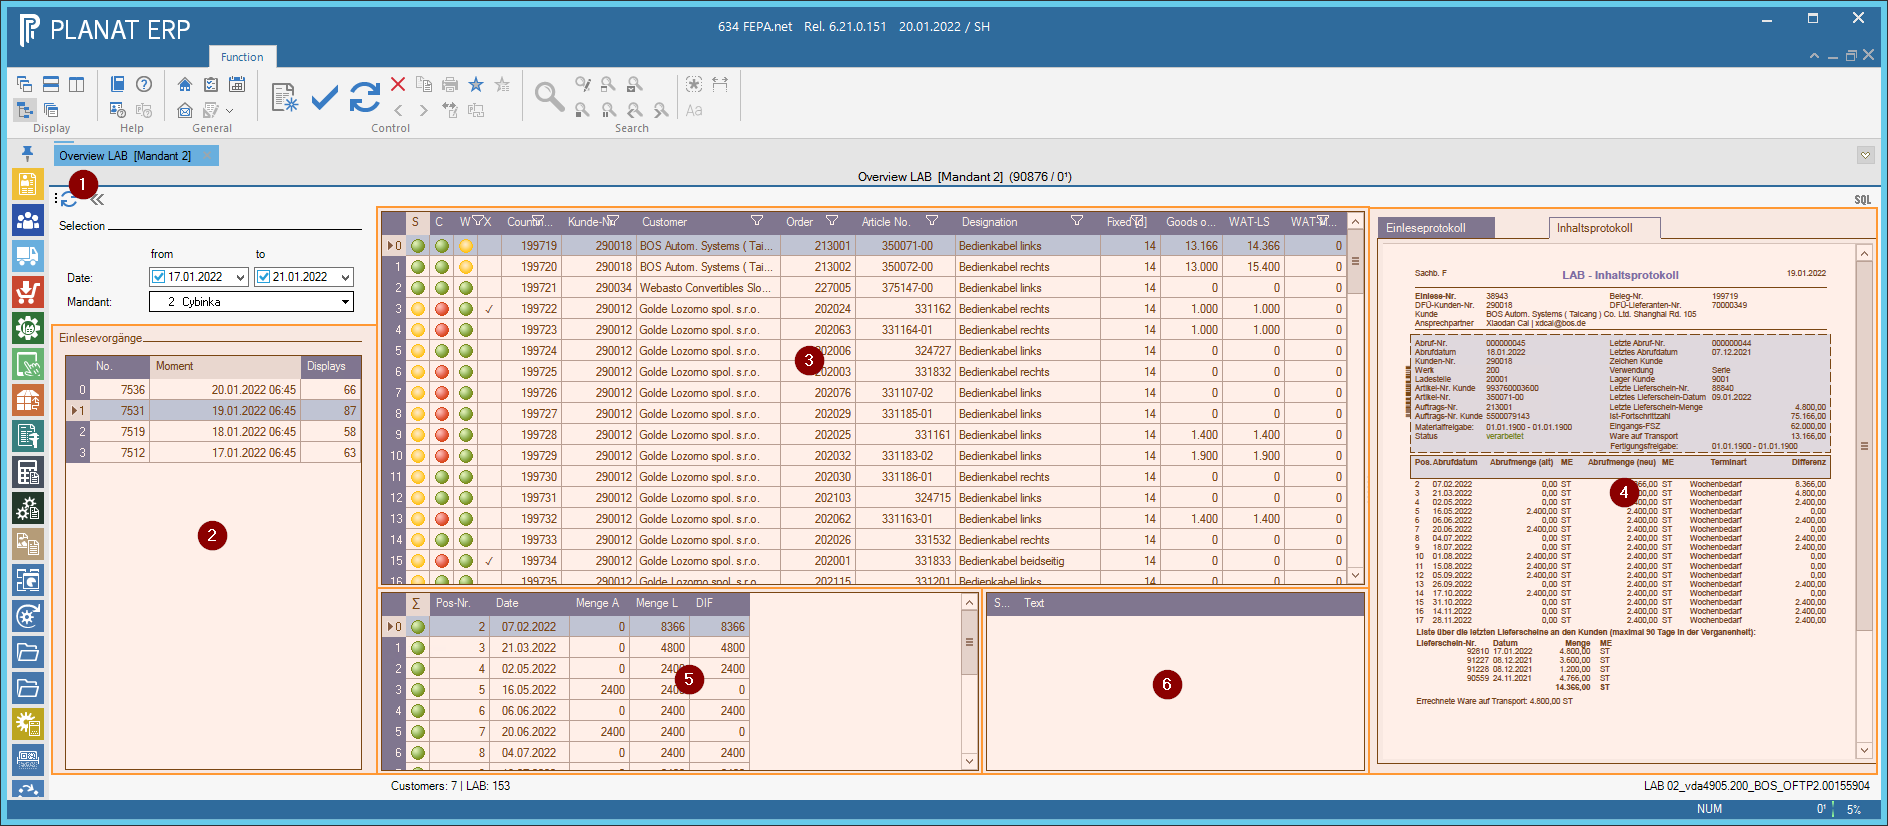
The program "Overview LAB" serves to arrange all read in delivery schedules (in the following "LAB") according to so-called read in procedures [2] and, after selection of a read in procedure, to represent the individual LABs clearly in a table and to provide with references, which support the user with the examination of the LAB.
The program allows us to dispense with printing out the LABs and have FEPA read in automatically in the background.
How the program works
After clicking on "Refresh" [1], the program displays in the area [2] the last import operations of the selected client within the selected period. After loading, the program always automatically selects the top entry. Whenever "Read in LAB" is started, a new read-in process is created and all LABs are then assigned to this process. In addition to the number of the read-in process, you can also see the time at which the process was started.
In the area [3] all LABs are displayed, which were read in the selected read-in process. The first entry in the list is automatically selected. With selection of a LAB:
- The associated documents in area [4] are loaded and displayed as PDF.
This includes the read-in log (DE "Einleseprotokoll"), check log (DE "Prüfprotokoll") and content log (DE "Inhaltsprotokoll"). - The changes in area [5] are loaded and marked in color. These are the changes compared to the sales order (not to the previous retrieval).
- The error and warning messages loaded in the [6] area. These are the messages that are also on the check log and that were determined when processing the call-off.
Traffic lights and markers
Area [2] contains three traffic lights and a column with a small checkmark symbol "✓" in the first four columns to give a quick overview:
- S = Status:
This column indicates if there is a problem with the status of the LAB.- Red = There are error messages and the LAB has not been processed.
- Yellow = There are warning messages, but no error messages. The LAB has been processed.
- Green = There are no warnings and no error messages.
- C = Changes:
This column indicates whether there were expected or unanticipated changes. The "Fixation" setting from the customer-plant relationship is taken into account. The fixation (e.g. 14 days) is a setting that can print a "red bar" on the content log to indicate the period of (e.g. contractual) fixation.- Red: there are messages about backlogs
Attention. This only means that the customer has reported this as "backlog" using "message type 333333". Whether this is an actual backlog must be checked. - Yellow: There are changes in the quantities.
If a firming is set up, then only changes within the firming trigger the status "Yellow", but changes outside the firming do not. If no fixing is set up then all items are taken into account. - Green: There were no changes and no backlogs.
- Red: there are messages about backlogs
- W = Goods in transit:
This column shows if there is a problem with the goods in transit. The WAT status is always calculated at the time when the LAB was read. The details of the WAT numbers can also be seen within the table [3] (scroll a little to the right).- Red: The WAT is greater than the setting for "Max WAT" on the job.
- Yellow: The WAT (difference of the two cumulative quantities) does not match the WAT based on the last delivery bills.
- Green: There is no problem with the WAT.
Notes
The program sometimes reacts a bit slower than usually used by FEPA. The reason is that the program always has to wait for the "file system" to display the PDF files. Unfortunately this cannot be fixed at the moment.